
Engineer PS economics with these benchmarks
A practical guide to set PS prices based on margin and utilization ranges from top SaaS companies and the PS Maturity Benchmark.

Professional Services (PS) has always been part of SaaS companies. A lever for accelerating subscription growth and improving long-term profitability, but often ignored in pricing strategy. So how should you price your Professional Services?
This article will equip you with a practical playbook how to price PS right. You’ll also get benchmarks to explain it from ten public SaaS companies and the SPI PS Maturity Benchmark.
1. SaaS companies usually make 2-9% of revenue from PS
Across our dataset of 10 of the largest SaaS companies cluster around 2-9% of revenue from PS. This signals that their product can scale without heavy customization.
This band is the sweet spot where:
Implementation stays repeatable
Product (not people) drive scale
Customization is not the default
This is the reason SaaS works - the product (not people) drive ARR.
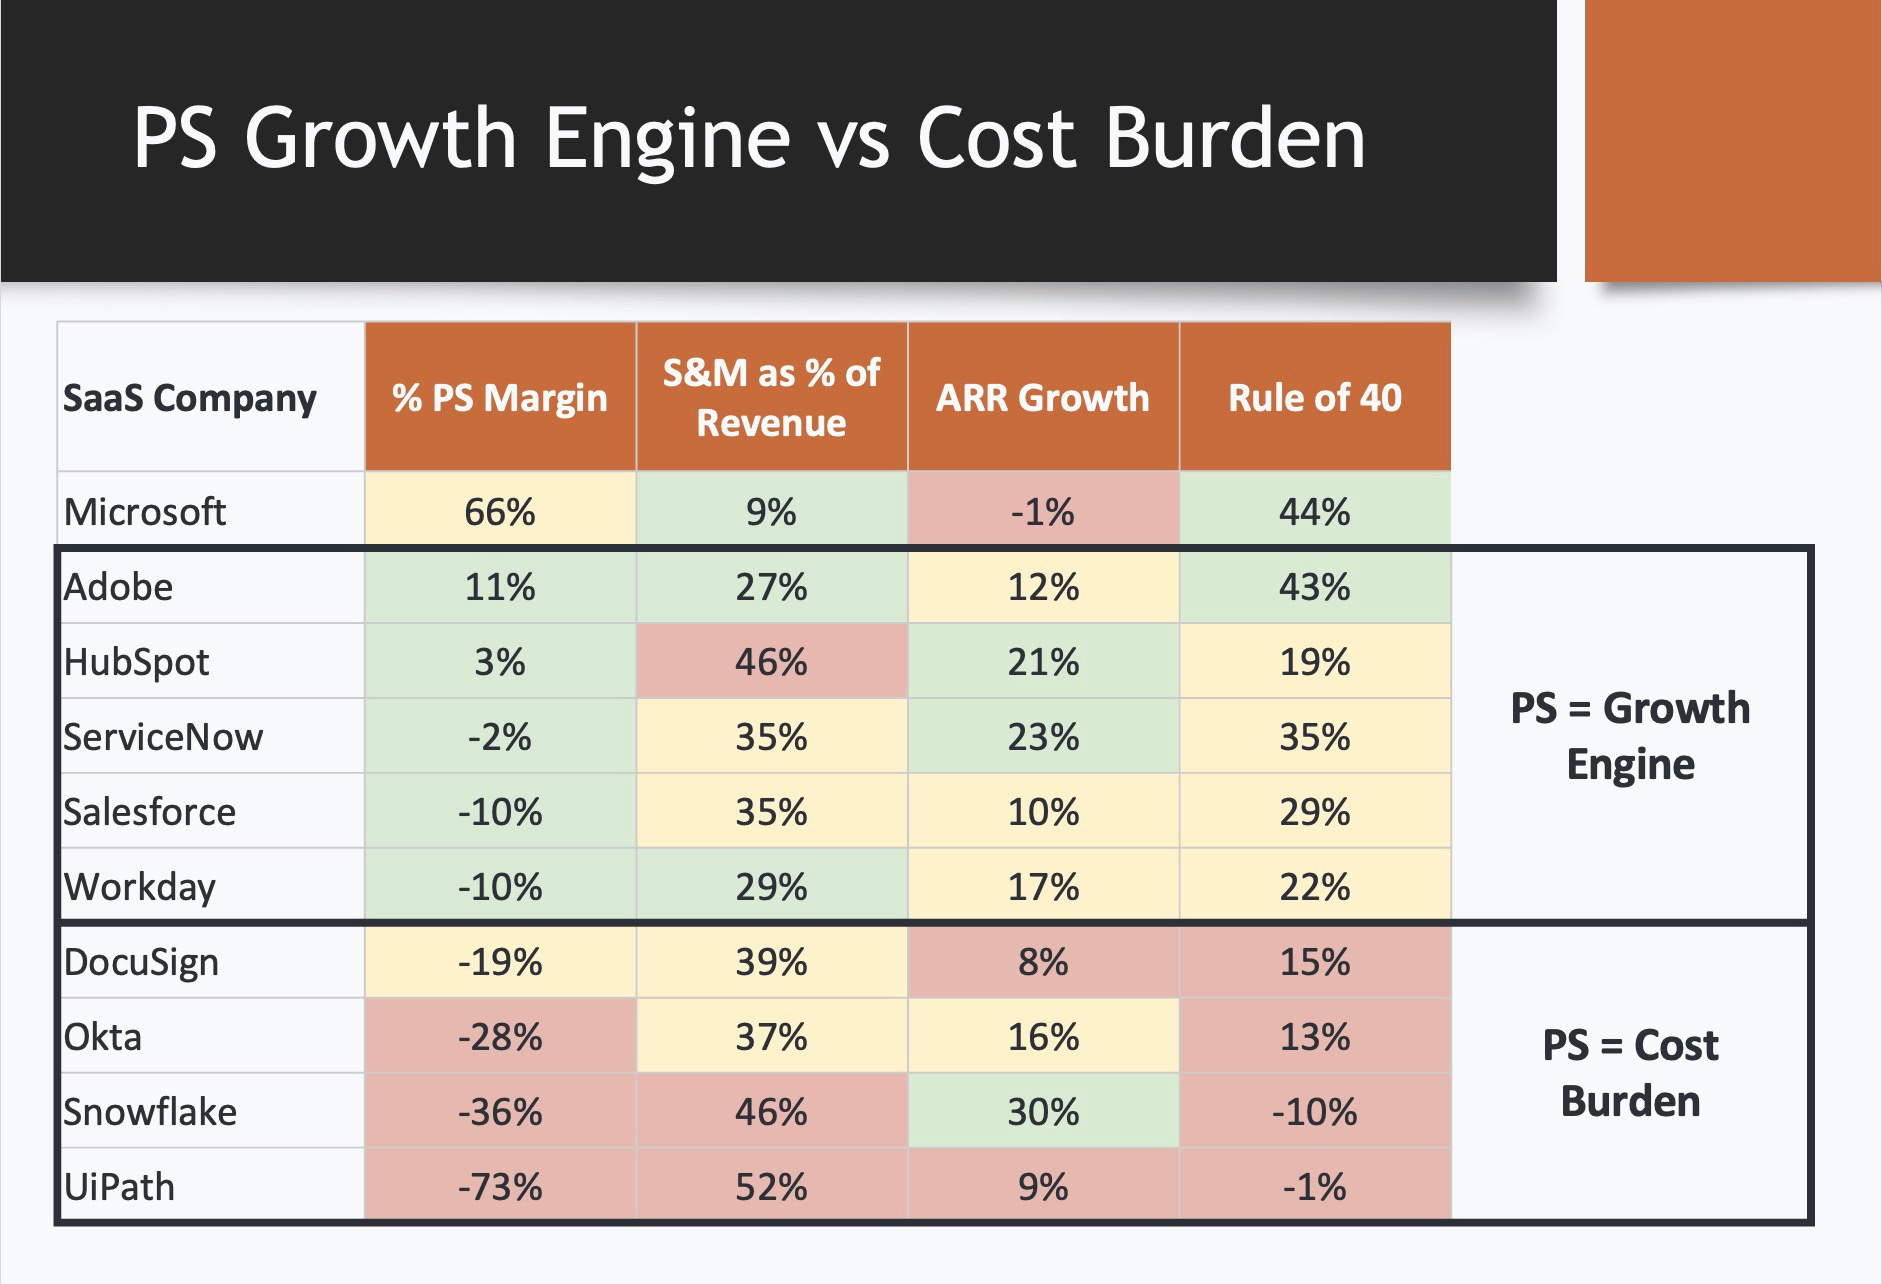
2. SaaS companies use PS along with S&M as a growth engine
A striking correlation shows up when you compare PS margin with growth rates.
The fastest-growing companies in the dataset invest 40%+ of revenue into Sales & Marketing, and price PS at or below cost:
Snowflake: 30% ARR growth YoY, -36% PS margin
ServiceNow: 23% ARR growth YoY, -2% PS margin
HubSpot: 21% ARR growth YoY, 3% PS margin
These companies use PS along with Sales & Marketing as a growth accelerator.
Affordable priced PS:
Reduces perceived switching cost
Accelerates time-to-value for customers
Unlocks upsell opportunities earlier
Most major SaaS players from workflow platforms to CRMs treat PS like a growth accelerator rather than a profit lever.
3. Pricing PS too low undermines scalability
There’s a tipping point where underpricing PS starts becoming damaging.
The Rule of 40 is a metric to ensure you’re on a path to profitable scale. We’ve calculated it here as:
“Rule of 40” = % ARR growth Year-over-Year + % Operating Margin
The companies that price PS far below cost also have the weakest “Growth + Operating Margin” results. DocuSign, Okta, Snowflake, UiPack all fall way short of the Rule of 40, and significantly underprice PS (-19% to -73% margin).
Excessively negative PS margins are a red flag because they highlight problems:
Low utilization / ballooning bench time
Skilled niche labor at high cost
Inefficient PS delivery model
4. The PS sweet spot is between -10% and 10%
Profitably growing SaaS companies meet or are just below the SaaS Rule of 40, e.g.
Adobe: 11% PS margin → 12% ARR growth + 31% operating margin = 43%
ServiceNow: -2% PS margin → 23% ARR growth + 12% operating margin = 35%
Salesforce: -10% PS margin → 10% ARR growth + 19% operating margin = 29%
The –10% / +10% range is an optimal balance that keeps PS affordable to accelerate time-to-value, while not turning into a cost burden.
A side note: The behemoth Microsoft stands out by achieving the rule of 40 even with declining ARR. Its 66% PS margin and heavy PS footprint (77% of revenue) helped it achieve its 46% operating margin.
5. The charge-rate playbook: how to engineer PS economics right
Even if your PS strategy is margin-neutral, you still need a rigorous charge-rate model, or you can drift into unintentional losses.
Every best-in-class PS organization uses a version of the following framework:
Step 1: Set the target margin (strategic, not arbitrary)
Think of margin as a design choice:
-10% to 10% for standard PS to fuel adoption and SaaS growth
30+% for optional value-added services. Consider pricing these on value, not hours
How to optimize: Don’t use the same target margin all your PS work, vary it based on the service. Understand the value of premium services that create value beyond your SaaS or AI offering (e.g. insights from data to optimize your customer’s business), and monetize these at a higher margin.
Step 2: Understand your cost to deliver
A PS org requires different skills and resources to deliver on the mix of work effectively. Understand your cost to deliver based on these three factors:
Skill mix & staff pyramid
Onshore / offshore mix
Fully-loaded salaries (base, bonus, benefits, taxes, tooling, overhead)
How to optimize: Understand what skill mix you require for the work you’re doing. Then be strategic about what to deliver in each geography. Some customers require reviews and collaboration on site, others are okay with remote work across timezones.
Step 3: Model utilization with real-world friction
How much time your team spends on billable work varies by your size, geography and PS maturity. The 2025 SPI PS Maturity Benchmark found that PS orgs within SaaS / Software companies usually achieve ~60-70% utilization. The rest goes towards:
Onboarding & training (a new hire in productive only after ~2-3 months)
Non-billable sales support & administrative work
Internal coordination & downtime between projects
How to optimize: Accelerate time-to-productivity for new hires through better onboarding, improve PS org’s visibility into upcoming demand by integrating sales pipeline visibility, and deploy PS automation and AI tools to effectively forecast and allocate resources proactively.
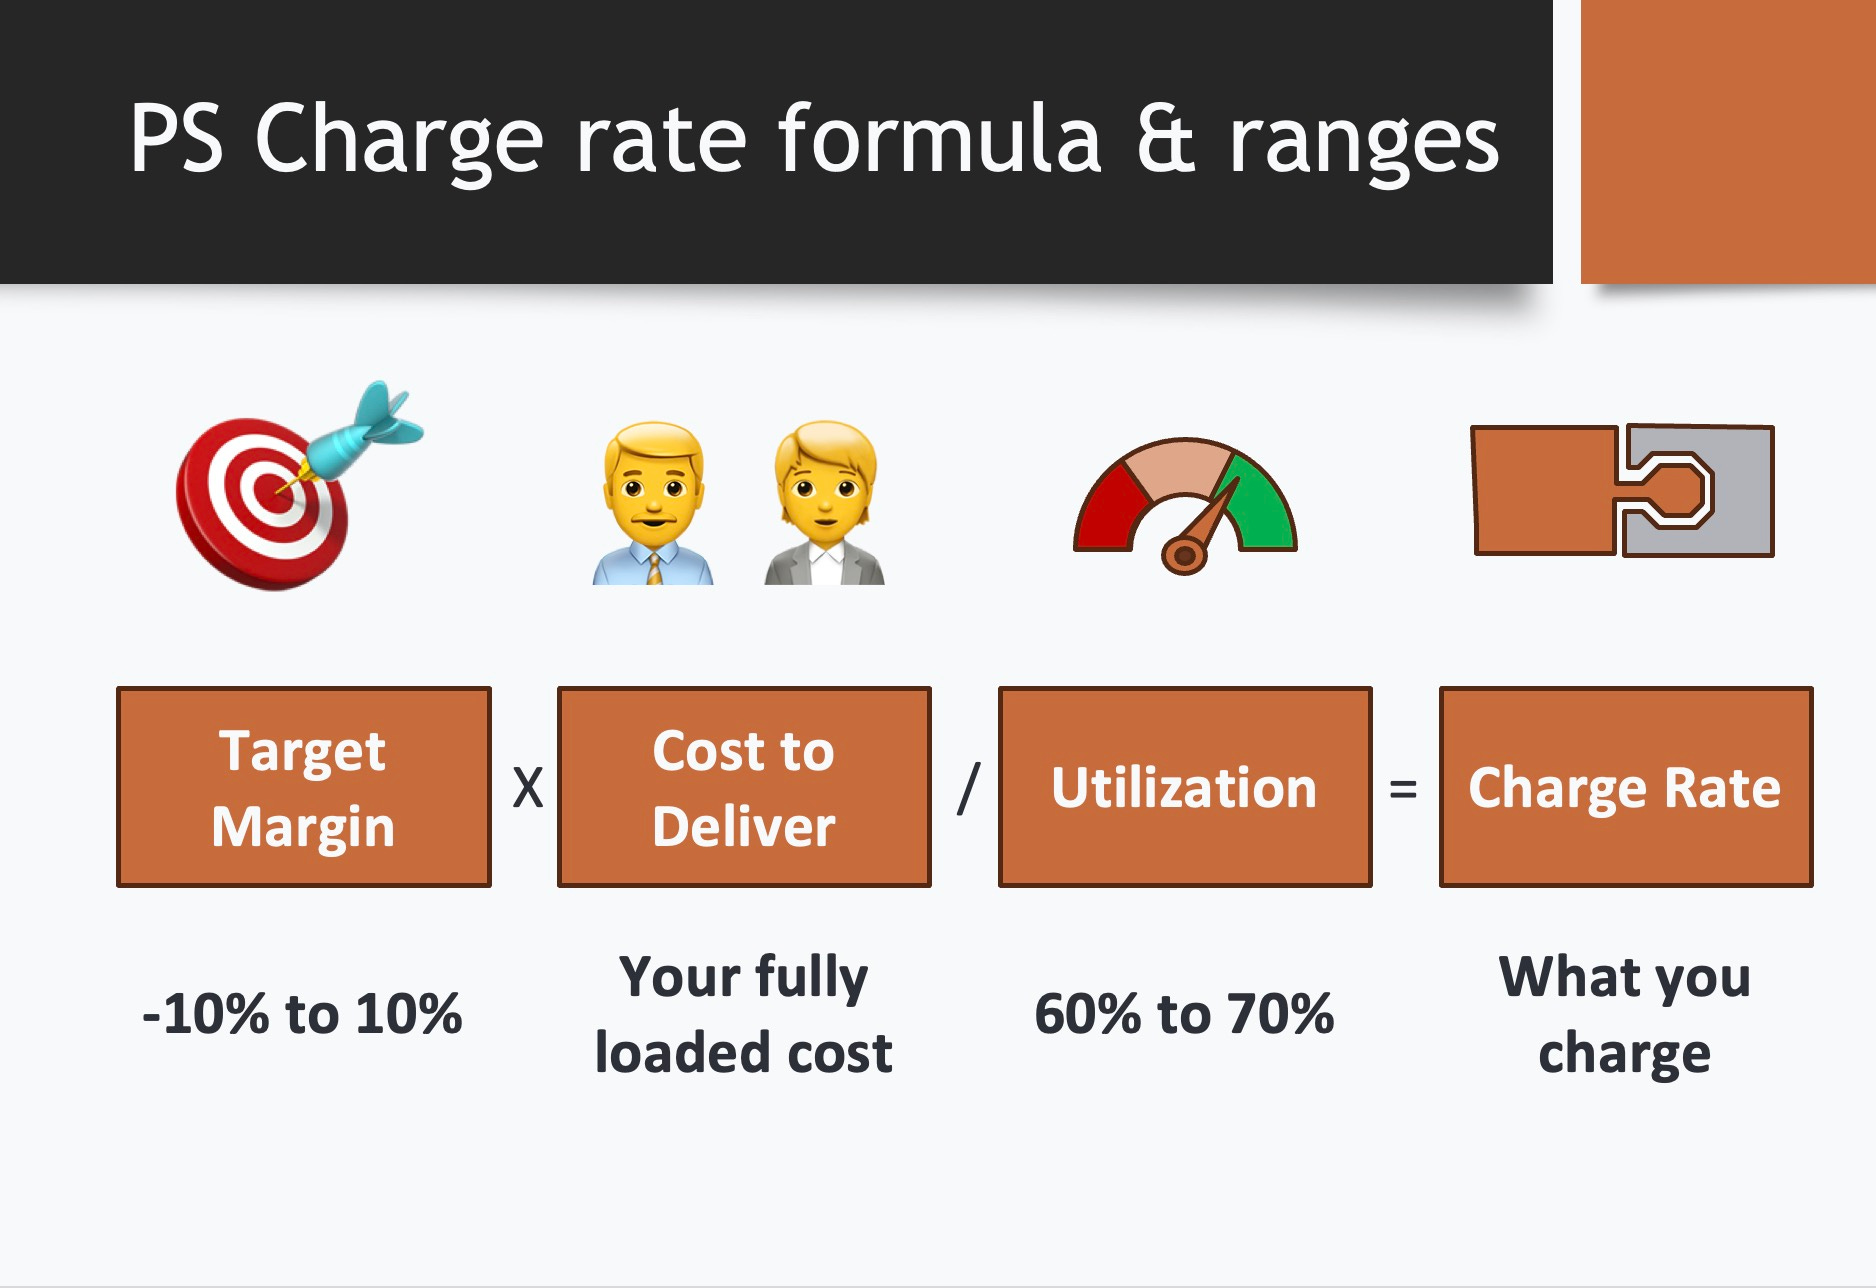
Step 4: Putting it together: the charge-rate formula
Charge Rate = (1 + Target Margin) x Cost to Deliver / Utilization
For example: if you aim for a 10% PS margin, your cost is 300k, and your utilization is 70%, you should charge 1.1 x $300k / 70% = $471k.
This ensures your PS pricing supports adoption and sustainable growth.
Final Reflection
PS is a growth accelerator, not a profit engine. Large SaaS players found the sweet spot for PS margins to be between -10% and 10% to power sustainable growth.
To deliver value at reasonable prices, optimize your staffing and delivery model, and increase utilization through faster onboarding and better tooling. That way your PS work can fuel profitable growth by accelerating product adoption and unlocking expansion opportunities faster.
It's interesting how you frame PS as a strategic growth engine. Your analysis of its contribution to ARR is very insightful. Im curious if data from these client interactions also serve as a powerful feedback loop for AI-driven product evolution, beyond just immediate scale.